Prevention: modifiable risk factors for heart disease
Cardiovascular health is determined in part by a range of modifiable factors. In the UK, 80% of the cardiovascular disease burden can be attributed to modifiable risk factors, such as diet, smoking status and medically manageable risk factors like high blood pressure. These factors are often influenced by access to health and care services and the social, physical, and economic environments in which people live. This has an impact on our choices, behaviours, and exposure to risk.
An estimated 28% of adults in England are living with obesity and a further 36% have a body mass index (BMI) defined as overweight. Breaking this down into deprivation deciles, the most deprived decile has consistently had the highest proportion of adults classified as overweight or obese from 2015/16 to 2018/19. The overall trend of adults who are classified as overweight or obese is rising. But the gap between the most deprived and least deprived areas has remained the same, ranging from a 9% to 11% difference in prevalence over the time period (68% versus 58%, respectively, in 2018/19).
More than 1 in 5 adults are physically inactive in England. The prevalence of physical inactivity is again higher in the more deprived deciles. A similar gap of 8-10% occurred from 2015/16 to 2018/19, showing the more deprived deciles with a higher prevalence of inactivity (26% versus 17%, respectively, in 2018/19).
We know that smoking can lead to a heart attack or stroke. It is estimated that at least 12,000 deaths from cardiovascular diseases in England each year can be attributed to smoking. Like the prevalence of adults classified as overweight or obese and physically inactive, smoking prevalence in adults also varies by deprivation decile. While the trend of smoking has decreased from 2015-2019, the gap in prevalence from the most deprived to least deprived areas has remained largely the same, with some variation in deciles in between. In 2018, the prevalence of smoking was almost double in the most deprived population compared to the least deprived (18% versus 10%). The gap reduced slightly in 2019, however that was due to an increase in smoking prevalence in the least deprived area.
Detection and diagnosis
When it comes to other conditions (e.g. CVD or heart failure prevalence) the effect of deprivation is not clear, which may be due to the fact that since cardiovascular diseases tend to occur later in life, the age of a population might be outweighing the effect of deprivation levels.
In many cases the gap between the most and least deprived deciles is less than 1%, however these gaps can translate to tens of thousands of people. This is true for stroke/transient ischaemic attack, peripheral arterial disease, heart failure, and coronary heart disease (CHD).
The prevalence of diabetes has been rising since at least 2012, with a slight increase in the gap between the most and least deprived deciles. The 2nd most deprived area (decile 2) has the highest prevalence of diabetes.
The gap between the most and least deprived deciles has narrowed from 2015/16 to 2019/20 for hypertension to 0.13%. However, there was a larger gap, of 2%, between the least deprived decile (10) and 3rd least deprived decile. This shows that there is variation in prevalence across the country, but it is not clearly defined by deprivation.
In the case of both diabetes and hypertension, the most deprived areas have a higher prevalence compared to the least deprived. However, the relationship to deprivation overall isn’t as clear as it is for obesity, physical activity or smoking.
These risk factor data are from Quality Outcomes Framework (QOF), which is a voluntary annual reward and incentive programme for all GP practices in England to reward good practice. It is important to note that the data is not age-standardised and there is evidence of a wide variation among practices in the size of the gap between reported and estimated prevalence. For a number of conditions, deprived practices and areas are failing to identify all cases of disease within their practice populations.3 According to a King’s Fund report: “practices that performed better on QOF had more complete recording of disease prevalence after adjusting for other factors. This suggests that practices are not gaming by failing to register patients. A more likely explanation is that well-organised practices that are able to achieve better QOF scores may also be more systematic in their approach to case finding.”4
Treatment
Prescriptions
Overall, there are long term, sustained rises in prescribing of antihypertensive, heart failure drugs and lipid lowering drugs, reflecting the increasing burden of heart failure in the population and efforts to manage high rates of high-risk conditions. The decline in the use of diuretics, at least in the context of use in management of hypertension, could point to changes in the approach to management of hypertension, although growth in heart failure prevalence may be expected to counteract this decline in use of diuretics.
Slower growth in anti-anginals, beta-blockers and anticoagulants is perhaps surprising given the rapidly dropping prevalence of coronary heart disease across the UK but may be indicative of changes in management of the disease in primary care where the majority of prescriptions are issued. A significant fall in the prescribing of anti-platelet drugs is more consistent with falling coronary heart disease prevalence.
There are differences in prescription rates between decile of deprivation, but this varies based on the type of drug. Our analysis shows that the least deprived areas have the lowest prescription rates for many of the most prescribed CVD drugs (for a list of definitions see Appendix 2). Among the drugs where the least deprived areas have the lowest prescription rates were antiplatelets; beta-adrenoceptor blocking drugs; diuretics; hypertension and heart failure; lipid-regulating drugs; and nitrates, calcium-channel blockers, and other antianginal drugs. In each of these, the 2nd most deprived decile had the highest rate of prescriptions and there was consistently a gap between the most deprived and least deprived deciles.
The 10th (least deprived) decile has the highest rate for anti-arrhythmic drugs, which may be due to the higher prevalence of AF in these areas.
Hospital admissions
It is difficult to see clear inequality trends within cardiac hospital admissions data. We looked at elective admissions compared with emergency admissions by deprivation. In this context an ‘elective’ admission means an admission that is planned; generally speaking a patient will be admitted to hospital from a waiting list for a specific procedure following diagnostic tests and specialist consultation. An ‘emergency’ admission is an unplanned admission, where the patient has been admitted via A&E or referred urgently by their GP. A decision to admit a patient as an emergency is not always made for life-threatening reasons, but can be for urgent diagnostic procedures or observation.
In the graph below, you can see that the average CVD emergency admission rate is consistently higher for those in the most deprived areas when compared to the least deprived. The opposite is true for elective admissions, showing that the least deprived areas have higher rates than the most deprived areas, with a growing gap due to fewer admissions in the most deprived decile. However, the highest rates of elective admissions occur in the middle deciles (5, 6, and 7) and the lowest rates are in the 4th most deprived areas.
Inequalities across all admissions (not just cardiovascular) are more clear cut, showing that the most deprived areas have the highest emergency admissions rate and the least deprived areas have the lowest emergency admission rate.5
This apparent inequality in emergency admissions could be driven by a lack of access to primary care and there have been reports in the past of so-called ‘under doctoring’ in more deprived areas. Looking at the number of GPs per 100,000 population, there are significantly more GPs in the least deprived decile than all others. There does not appear to be, on the whole, a general relationship between relative deprivation and numbers of GPs. However, it should be noted that if GP capacity were related to need we would expect see a pattern of high number per 100,000 in the most deprived decile, and lower numbers in least deprived areas. This is not apparent here.
Number of GPs (headcount) per 100,000 people, by decile

Ischaemic heart disease, also called coronary heart disease, is when coronary arteries that supply the heart with oxygen-rich blood become narrowed by a build-up of fatty material. Coronary heart disease is the most common type of heart disease and if a blockage occurs it can cause a heart attack. It’s also the single biggest cause of premature death in England.
The gap in prevalence between the most and least deprived decile is less than 1%. However, the graphs below that show that the most deprived deciles have lower admissions rates from 2016-2019 for elective care when compared with the least deprived areas. The elective admissions rate for coronary heart disease is 17% higher in the least deprived areas compared to the most deprived. This suggests that people in the most deprived areas are not being referred as often for elective admissions.
Acute myocardial infarction, or heart attack, is a medical emergency when there is a sudden loss of blood flow to a part of the heart muscle. There are over 80,000 hospital admissions for heart attacks each year in England. The emergency admissions rate for heart attacks in 2019 were 30% higher in the 2nd most deprived decile and 16% higher in the most deprived decile compared to the least deprived decile.
There has been an effort in England to reduce emergency admissions. This has included primary care improvement policies, as 14% of emergency admissions in 2015/16 were for conditions that could be managed in primary care. However, the trend of increasing emergency admissions continues to grow. This makes it difficult for hospitals to reliably deliver elective care.6
A Nuffield Trust report reviewed initiatives that aimed to avoid hospital admissions. They found that the initiatives with the most positive outcomes are for condition-specific rehabilitation, such as pulmonary and cardiac rehabilitation.7 These improve quality of life and reduce hospital admissions.
Long-term management, support and outcomes
Cardiac rehabilitation
Cardiac rehabilitation is an evidence-based intervention, delivered by a multidisciplinary team, that is proven to be clinically and cost effective for improving physical and health-related quality of life outcomes after a cardiac event.8
The National Institute for Health and Care Excellence (NICE) Clinical Guidance (CG172, CG94 and NG106) and leading British and European cardiovascular professional associations recommend that cardiac rehab should be offered to all eligible patients in a timely and appropriate manner, taking the form of group-, home- or web-based sessions and with a recommended minimum duration of eight weeks.
Cardiac rehab data comes from NACR, where a number of UTLAs had less than 30 patients total. These cannot be broken down by demographics in order to protect confidentiality and were therefore excluded from the analysis (Appendix 3).
On average, cardiac rehabilitation uptake hovers around 50%. The gap between the number of people who started cardiac rehab in the most versus least deprived areas has narrowed between 2015 and 2019 for White people, males, and females. In each of these, uptake within the least deprived decile has remained higher than in the most deprived area the majority of the time frame. The 4th most deprived decile consistently has the lowest percentage of people starting cardiac rehabilitation by ethnicity, sex, and marital status.
The percentage of people with a minority ethnic background in the most deprived areas who start cardiac rehab has fallen slightly over the last few years, resulting in an increased gap in uptake between the most and least deprived areas overall between 2015 and 2019. People in the most deprived decile who started rehab with a minority ethnic background had a lower uptake than White people in the same decile (43% versus 48%), whereas the difference by ethnicity in the least deprived decile was smaller (52% for people with a minority ethnic background versus 53% for White people).
Uptake is better overall for people who have a marital status of ‘partnered’ compared to those who are single. However, people in the most deprived areas have the same percentage of uptake (55%) whether they are single or partnered. In contrast, those in the least deprived areas have an 8% difference in uptake for those who are single (53%) versus partnered (61%). This could be due to people in more deprived areas lacking the flexibility to take time off work or childcare to prioritise their health, whether single or partnered. In the least deprived areas, people with partners may be more likely than their single counterparts to have the financial and social stability that allows them to attend cardiac rehabilitation programmes.
GP survey data
Patient activation measures describe the knowledge, skills and confidence a person has in managing their own health. It is widely acknowledged that those who have the confidence and skills to manager their own health are more likely to adopt healthy behaviour, to have better clinical outcomes and lower rates of hospitalisation, and to report higher levels of satisfaction with services.9
This extends to the management of long-term conditions where higher activation scores are positively correlated with adherence to treatment and condition monitoring, as well as obtaining regular care associated with the condition. The findings appear to be true for patients with a range of conditions and economic backgrounds, including disadvantaged and ethnically diverse groups and those who have less access to care.10
The GP Patient Survey is sent to over 2 million people across the UK and collects some basic patient activation data. It is carried out annually to capture the experience and demographics of patients at their GP practice. It helps monitor the quality of services over time.
Respondents are asked to report any long-term condition, and in the last three years around one-third of the respondents reported having CVD.
The survey captures patients’ confidence in managing their condition(s), with four options: very confident, fairly confident, not very confident, or not at all confident. Although this analysis includes people with any long-term condition, rather than CVD only, it is useful to examine this holistically since many people have multiple conditions and do not think of managing them in isolation. They are likely to consider having confidence in managing their conditions overall.
The survey data show a clear and consistent gap in confidence from 2018-2020, emphasising that those in the least deprived decile are most confident in managing their condition compared with those in the least deprived decile. In the least deprived areas, around 89% report feeling “very confident” or “fairly confident” managing their condition. In the most deprived areas, this drops to about 81%. A higher percentage of respondents (4%) in the most deprived decile report being “not at all confident” at managing their condition than those in the least deprived areas (2%).
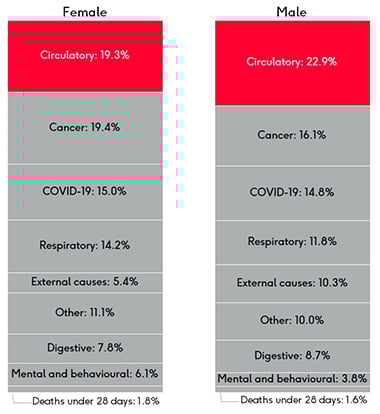
Outcomes: mortality rates
Mortality rates from cardiovascular disease are clearly linked to deprivation deciles in the graphs below. The gap between the age-standardised death rates (ASDRs) for cardiovascular disease in all ages has increased slightly from 2013 to 2019 and is twice as high in under 75s for the most deprived versus least deprived areas.
ASDRs by sex
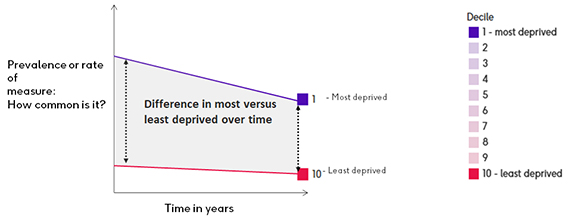
As mentioned previously, the slope index of inequality (SII) is another indication of inequality. Diverse populations, from very affluent to very deprived, tend to have wider health inequalities and, as a result, are more likely to have differences between the different population deciles. This would tend to be represented by a higher SII (with a lower ranking). More stable and uniform populations will tend to have a lower SII, reflecting smaller differences in population structure.11
It is known that women have a longer life expectancy than men. This gap persists within cardiovascular disease. Recent ASDRs (2017-19) for CVD in under 75s are higher for the most deprived areas when looking at SII and IMD indicators in both men and women. In the graphs you can see that the under 75s in UTLAs with higher SII rankings have higher ASDRs due to CVD. The same is true for the most deprived IMD deciles, marked in purple.
Middlesbrough had the highest SII for women, with a 10.0 year gap in life expectancy between the most and least deprived and a pre-mature CVD ASDR of 65.1 per 100,000. Windsor and Maidenhead had the lowest SII for women (less than 1 year difference in life expectancy between the most and least deprived) and a pre-mature CVD ASDR of 36.6 per 100,000.
While Middlesbrough had the second highest SII for men, the highest SII is in Stockton-on-Tees with a 12.6 year gap in life expectancy between the most and least deprived and a pre-mature CVD ASDR of 101.4 per 100,000. The lowest SII for men was in Shropshire with a 2.5 year gap between the most and least deprived and a pre-mature CVD ASDR of 82.9 per 100,000.
3, 4 King's Fund (2011) Impact of Quality and Outcomes Framework on health inequalities
5 Strategy Unit (2021) Socio-economic inequalities in access to planned hospital care: causes and consequences
6 Health Foundation (2018) Briefing: Emergency hospital admissions in England: which may be avoidable and how?
7 Imison C, Curry N, Holder H, Castle-Clark S, Nimmons D, Appleby J, Thorlby R and Lombardo S (2017) Shifting the balance of care: great expectations. Research Report. Nuffield Trust.
8 Anderson L, Oldridge N, Thompson D R, et al. (2016) Exercise based cardiac rehabilitation for coronary heart disease: Cochrane systematic review and meta-analysis.
Rauch B, Davos C H, et al. (2016) The prognostic effect of cardiac rehabilitation in the era of acute revascularisation
9, 10 The King's Fund (2014) Supporting people to manage their health: An introduction to patient activation
11 NHS Hammersmith and Fulham, NHS Kensington and Chelsea, NHS Westminster Slope Index of inequality briefing