Virtual heart map to help doctors locate artery blockages

A research team at the University of Sheffield is developing a groundbreaking way to identify blockages in the heart using a virtual blood pressure gradient test.
Professor Julian Gunn is leading the research, which we have awarded a grant of £295,000.
Currently, when a patient has a cardiac event or sees their doctor to complain of chest pain, they will often be sent for an angiogram – an X-ray used to examine blood vessels that can show whether patients have coronary artery disease, where fatty plaques build up in the vessels supplying blood to the heart. However, because the results aren’t always clear, there can be ambiguity as to where the problem areas are and their severity.
A pressure wire test can be performed to more accurately measure the blood pressure gradient across a narrowing within the heart, and tell doctors whether a person will benefit from treatment to open the blood vessels up. However, few people receive the test as it is expensive and time-consuming.
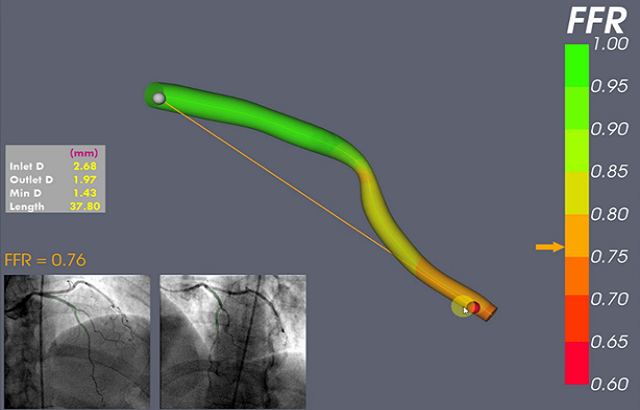
Prof Gunn and his team have developed a computer model called virtual Fractional Flow Reserve (vFFR) that calculates the pressure measurements from pictures of the blood vessels without needing the wire. It could provide greater clinical insight for doctors when making decisions about how to treat coronary artery disease.
Using data collected from hundreds of existing angiograms, the software has been proven to be accurate as tested against real pressure wire measurements. It displays the pressure gradient in colour, a healthy blood pressure gradient being green, and a significant pressure gradient in red.
Better outcomes for patients
The translational research is currently being trialled in real hospital settings involving over 400 people with coronary heart disease. Doctors at participating hospitals will decide what treatment their patient needs based on an angiogram. The vFFR model then re-analyses the angiograms, and the doctor can decide whether they would change the patient’s treatment plan based on the alternative results.
“We’ve had an excellent response so far from both patients and clinicians, which suggests that there could be a good uptake of this software in a real-life scenario,” said Prof Gunn. “It’s non-invasive and doesn’t require patients to do anything extra, yet it can shed more light on what is going on in their heart than a standard angiogram.
“If this translational project is a success and the software is rolled out, it could make interventions more accurate, reduce the number of unnecessary stents and bypasses, reduce the error rate, and save money and time,” added Prof Gunn. “The more insight we have into where potential blockages are, the better outcomes will be for patients.”
Our Senior Research Adviser Dr Natasa Levicar said: “Thousands of people require an angiogram in this country every year. By funding this project, we are helping to develop an innovative clinical tool which could provide important clinical information and help doctors make better-informed and more accurate decisions about how to treat patients with coronary artery disease.”
Watch an angiogram - 360 degree video